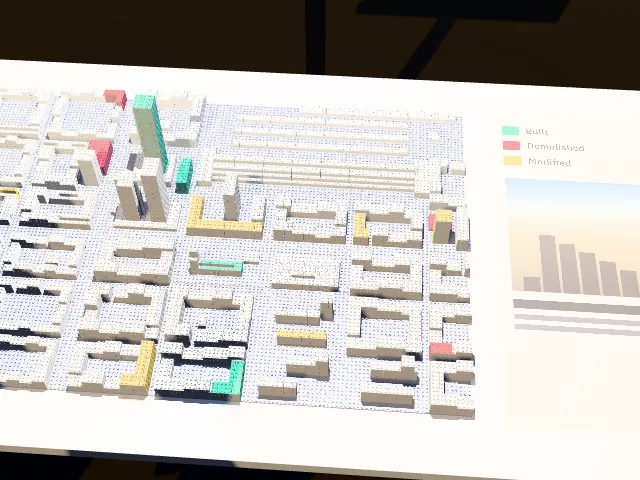
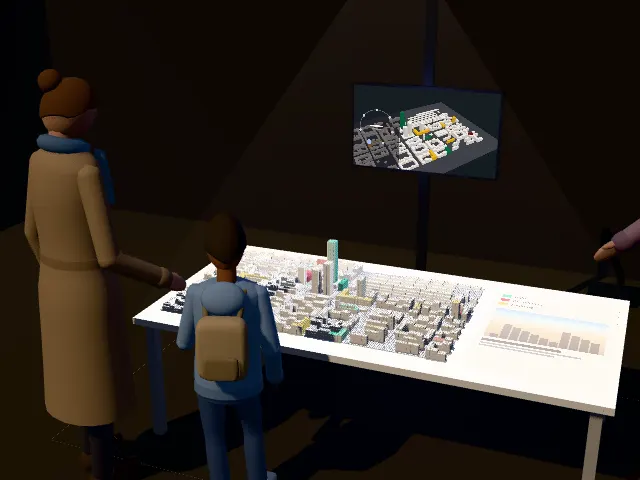
A white brick model of a city district on a table: blocks with courtyards, a railway station and a few towers. A projector on a mast colours some buildings green, red and yellow to show what was built, demolished or modified, and projects a picture next to the model. Three people stand around the table; one holds a numeric keypad. A screen on the mast shows a timeline.

From a 3D city model to a brick model you can build, project on and discuss around.

Turn your 3D city data into white bricks, with the parts to buy, step-by-step instructions and a projection layer.

Read the story as text

The story of the animation

  1. A table, a projector, a screen.
  2. The Legonizer turns a 3D city model into a brick model.
  3. Project urban data onto the white bricks.
  4. See how the district changed, and talk about it together.
  5. Build yours.

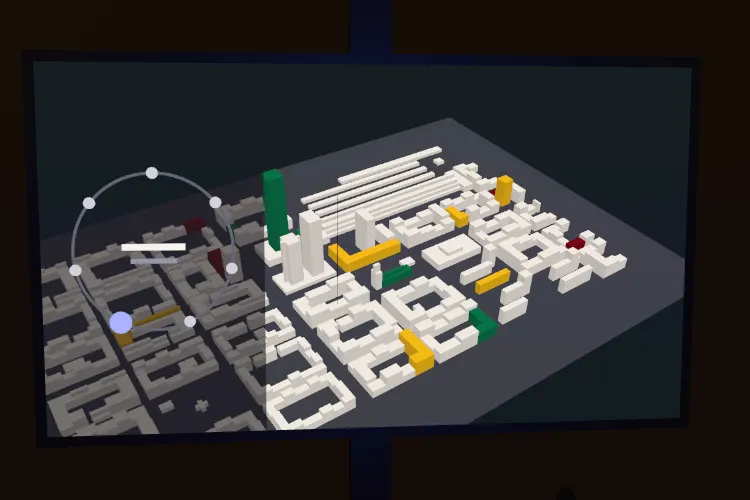
In the change layer, green means built, red means demolished and yellow means modified.
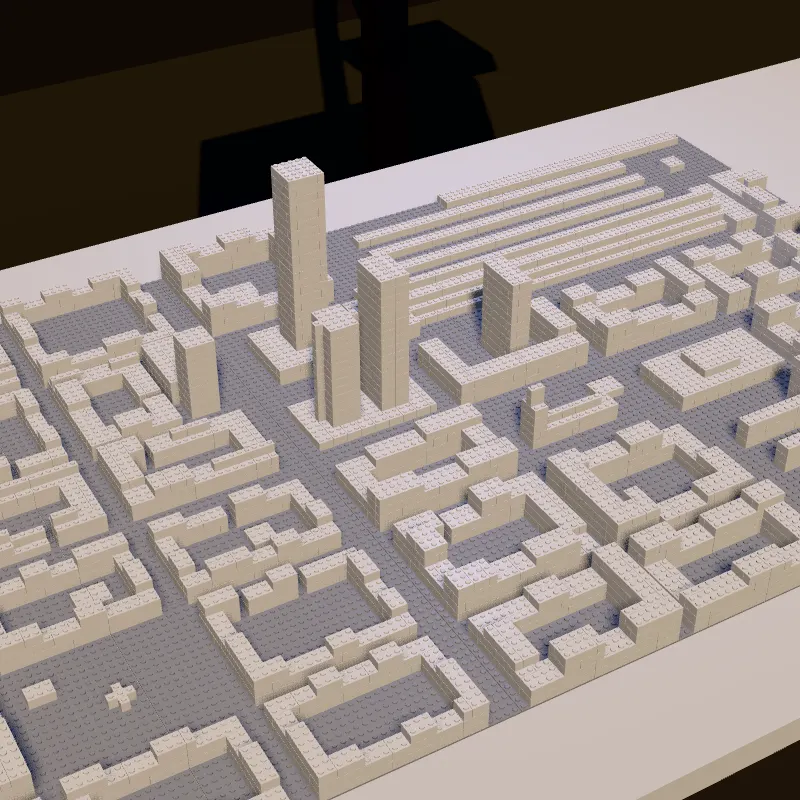
A brick model of your city, ready to build

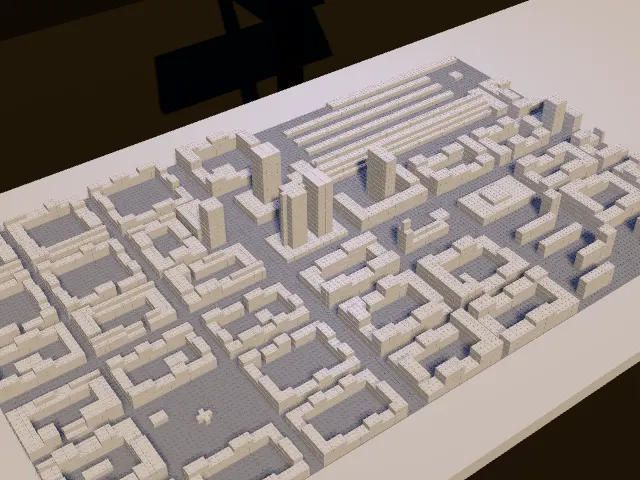
The Legonizer turns a 3D model of a city into a model made of white bricks on square baseplates of 32 × 32 studs. It gives you everything you need to build it: the list of bricks to buy, step-by-step building instructions and a projection layer for your projector.

A district built with white bricks on grey baseplates.
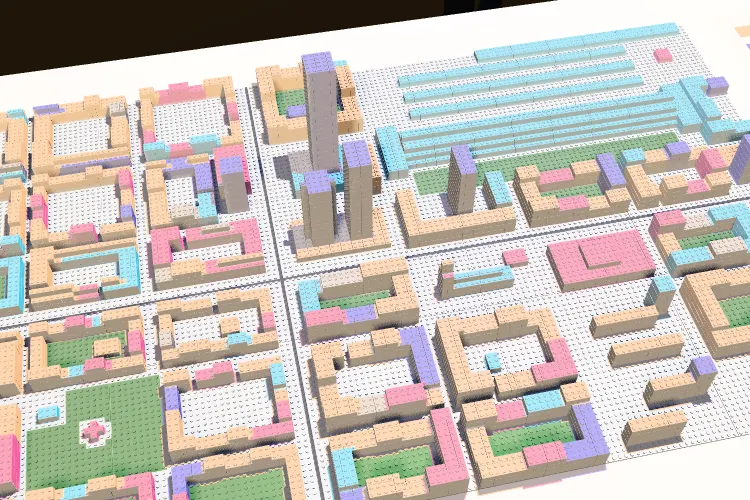
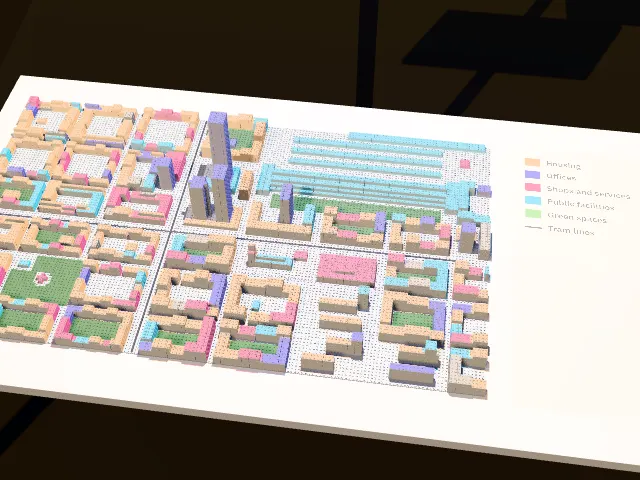
Coloured data projected onto a white brick model.
A screen showing the same district in 3D.

Why bricks, and why project on them?

A physical model brings people around one table. A digital model can show data, change and time. An augmented model combines both: a projector shows urban data on the bricks while a screen shows the 3D city.

Around one table

Everyone looks at the same model and can point at it. It is easier to talk about a place together.

You can touch it

People walk around the model, lean in and recognise their street, even if they don't read maps.

White bricks make a screen

The projector lights up the white bricks with building uses, green spaces or tram lines, right where they are.

Modular, reusable, playful

Take it apart and build another district, or the same one at another scale. Building it together is part of the fun.

How it works

  1. 1. Import a 3D city model

    Use our sample or your own file: 3D Tiles, glTF, OBJ or CityJSON. Everything stays on your computer.

  2. 2. Choose the area and the scale

    Draw the district you want and see how big it will be on the table before you start.

  3. 3. Build it, project on it

    Get the parts list, step-by-step instructions, shopping lists and the projection layer.

Create your model

What you get

A brick shelf

Every brick you need, drawn to scale, with quantities and part numbers.

3D instructions

Plate by plate, layer by layer. Works on a phone at the table.

A printable guide

A map of the plates, a height grid and a diagram for every layer.

Shopping lists

Ready to import on BrickLink or Rebrickable.

A projection layer

A top view of your model to line up the projector and draw your own data layers.

Data files

The height of every stud (CSV), a 3D model for LDraw tools and a project file to start again later.

Who it's for

Workshop facilitators and museums

Build a district for a public workshop, an exhibition or a neighbourhood project centre.

Urban planners and researchers

Make a model of a precise area at a precise scale, with settings you can reproduce.

Teachers, students and makers

Learn about your city by building it, starting from a ready-made demo.

Use case: a workshop on a changing district

Take a district that has changed over the years: towers built near the station, blocks demolished or renovated. Here is how a workshop group can use the Legonizer to talk about it.

  1. Build

    The group builds the district from white bricks, one baseplate per team, following the instructions.

  2. Project

    The projector shows what each building is used for, the green spaces and the tram lines, right on the bricks.

  3. Compare

    The screen shows earlier versions of the district. The projector colours the buildings that changed: green for built, red for demolished, yellow for modified.

  4. Discuss

    Pictures and documents appear next to the model. A numeric keypad passes from hand to hand to switch layers and versions.

Credits

The Legonizer comes from research on augmented physical models of cities by C. Le Bihan Gautier, J. Delanoy and G. Gesquière, VCity team, LIRIS lab (CNRS, Université de Lyon).

Représentation de l'évolution urbaine à travers une maquette tangible de territoires. Journées Françaises de l'Informatique Graphique (JFIG), Strasbourg, October 2024. hal-04924304.

Read the paper on HAL

It extends the Legonizer widget of UD-Viz, the VCity team's open-source framework for urban data.

UD-Viz on GitHub

Demo data: generated by the Legonizer, no real-world data.

The district in the animation is invented, and so are the building uses, green spaces, tram lines, changes and pictures shown on it. The brick model is real output: our own pipeline turned that district into bricks.